
Since the Inflation Reduction Act (IRA) took effect in 2022, the market for transferable tax credits has exploded. The creation of transferability is a large reason why: it offers a simpler, less expensive alternative to traditional tax equity. Drawing on our own database of public company financial information, this article shows, with empirical evidence, why the recent growth is coming from smaller buyers.
Research Methodology
Over the past year the Concentro team has built an in-house system that aggregates financial disclosures from publicly traded companies, covering every year since transferability began. We then validated the data via random-row audits where we would verify the information captured accurately maps back to the source document.
Once we felt comfortable with the information quality in our proprietary database, we approached the data in two ways. The first pass was top-down: define the universe and explore what trends emerged. The second pass, which produced this article, tested a specific hypothesis – that smaller companies were driving growth – by reformatting data and adding or removing attributes to see whether the pattern survived.
The trends below are consistent across multiple cuts of the data, and align with what our transaction team is seeing qualitatively in the market.
All figures in this article reflect total disclosed tax credit purchases, including both transferable credits and traditional tax equity investments. We expect these numbers to be slightly understated as some companies disclose purchases without reporting the exact amount.
Finding 1: Small-Cap purchase volume is growing nearly three times faster than large caps.
The growth of the tax credit market – calculated through total tax credit volume purchased – shows that smaller company appetite has grown dramatically since tax credit transfers were introduced. Between fiscal year 2023 and fiscal year 2025, the Russell 2000’s (the smallest 2000 companies on the Russell 3000 list) purchase volume compounded at 80% against the 30% compounded growth for the Russell 3000 and Fortune 1000 list. Fiscal 2023 is a natural baseline as it was the first year credit transfers were permitted.
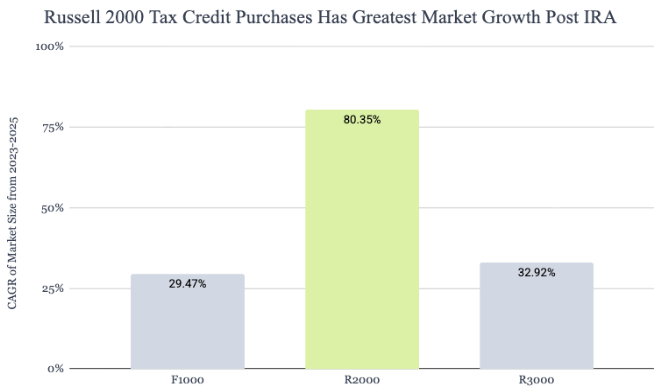
This staggering growth is evidence that the regulatory framework passed in 2022 is working as designed. Before transferability, monetizing a tax credit meant forming a minority partnership with a renewable energy developer – a tax equity deal – requiring a team of lawyers, a longer timeline, and higher overall costs. Transferability offers a less legally complex, faster process, and ultimately lower cost alternative purchase structure, which is the very strategy that aided smaller buyers in joining the market.
Finding 2: Inside the Fortune 1000, the same pattern of smaller buyers driving market growth repeats.
After Finding 1, our intuition led to a hypothesis: if smaller companies are driving growth across the top 3000 companies, does the same hold true inside the top 1000? We split the Fortune 1000 in half by size and compared the two. From fiscal year 2023 to 2025, purchase volume among the bottom half (companies ranked 501 to 1000) compounded at roughly 125% a year whereas the top 500 compounded at roughly 25%.
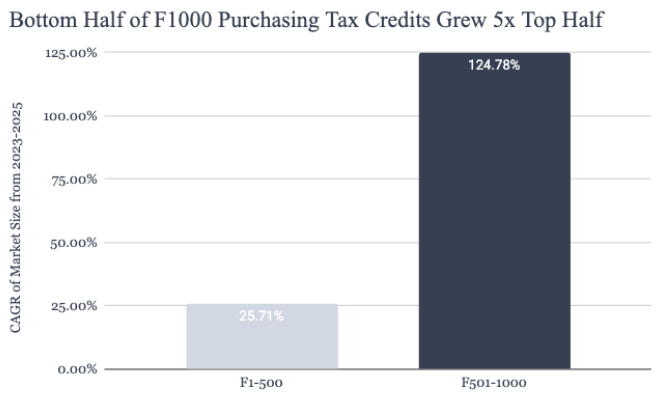
As we see, the same trend emerges, suggesting that growth in purchasing volume isn’t simply large cap versus small cap, it's that relative company size predicts growth wherever you draw the line.
Finding 3: The large companies haven’t lost their appetite, they started from a more mature market and hence larger base.
Faster growth among smaller companies does not mean large-cap appetite is shrinking. In absolute terms, smaller companies are still buying far less: the median purchase in the Russell 2000 is around $10 million, against roughly $90 million in the Fortune 1000. The chart below shows the gap in base amounts. Large corporations entered fiscal 2023 already buying at scale via tax equity structures – the difference is that the smaller end of the market is growing from a base that barely existed three years ago.
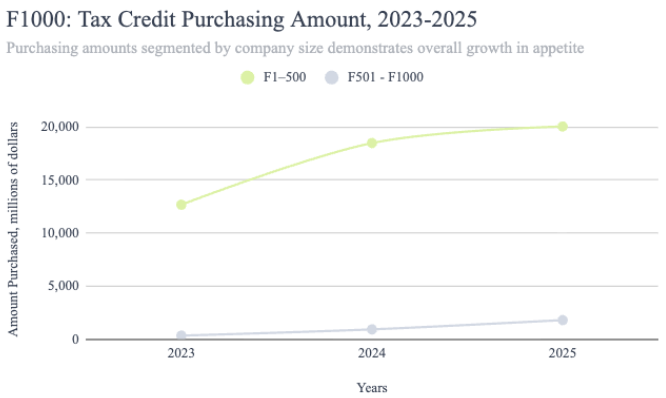
The gap in scale shouldn’t obscure what the data shows: the entire market has grown. Transferability unlocked smaller, simpler purchases that previously lacked economical routes to monetization, and the Fortune 1000’s own volume rose over the same period rather than being displaced. Both ends of the market are larger than they were three years ago – put simply, a rising tide lifts all boats.
Closing thoughts
These trends match what our deal team has been seeing in practice all year: smaller companies are increasingly entering this market as they realize the financial benefits to building a tax credit purchasing strategy. Three years into transferability, the shift is visible in the data and we expect the market to continue to grow.
The Concentro team is thrilled to be at the forefront of this market and helping it scale. If you’re evaluating whether purchasing credits makes sense for your team, we’d be glad to talk through it.